Blogging websites fail Core Web Vitals primarily because they rely on heavy themes, unoptimized images, excessive third-party scripts, and ad or analytics stacks that delay rendering and destabilize layouts.
The result is poor Largest Contentful Paint, high Interaction to Next Paint, and unstable Cumulative Layout Shift, even on sites with strong content.
These failures are structural, not cosmetic, and they can be traced to specific technical decisions that are common across WordPress and similar CMS-based blogs.
Core Web Vitals in Context: What Google Actually Measures
Core Web Vitals became ranking signals in 2021 and were updated in March 2024 when Interaction to Next Paint replaced First Input Delay.
As of 2025, Google evaluates real-world user data collected through Chrome User Experience Reports, not lab simulations alone. A page passes Core Web Vitals only if the 75th percentile of real users meets all thresholds.
Metric
What It Measures
Passing Threshold
LCP
Time until the main content renders
≤ 2.5 seconds
INP
Responsiveness to user interactions
≤ 200 ms
CLS
Visual layout stability
≤ 0.1
Most blogging websites fail because they optimize for appearance and plugins rather than for the browser rendering pipeline. Themes are chosen for design demos, not for critical rendering paths.
Plugins add JavaScript without coordination. Ads and embeds shift layouts after load. Each metric breaks for a different reason.
Largest Contentful Paint: Why Blog Pages Load “Visually” Too Late

Largest Contentful Paint measures how long it takes for the largest visible element, usually a hero image or the article title block, to render. On blogs, LCP failures are overwhelmingly caused by slow image delivery and render-blocking CSS.
Blog themes often place a large featured image at the top of the post, loaded at full resolution, without preload hints or size constraints.
Even when lazy loading is enabled globally, browsers do not lazy load the LCP element by default, so the image still blocks visual completion. When that image is served from a shared hosting environment without a CDN, LCP regularly exceeds four seconds on mobile connections.
Another frequent issue is CSS bloat. Many blogging themes ship with a single global stylesheet exceeding 300 KB, blocking rendering until fully downloaded and parsed.
Because browsers cannot render text without CSS, even lightweight articles appear blank for seconds.
Common LCP Cause
Why It Happens on Blogs
Direct Fix
Oversized hero images
Theme defaults prioritize aesthetics
Preload LCP image, serve responsive sizes
Render-blocking CSS
Monolithic theme stylesheets
Inline critical CSS, defer the rest
Slow server response
Cheap shared hosting
Improve TTFB via caching or better hosting
Web fonts are blocking text
External font loading
Use font-display: swap
Solving LCP on a blog almost always starts with identifying the LCP element in PageSpeed Insights and treating it as critical content.
That means preloading it, compressing it aggressively, and ensuring no CSS or JavaScript delays its rendering. Without this, no amount of caching will pass the metric.
Interaction to Next Paint: Why Blogs Feel Laggy When Clicked
View this post on Instagram
Interaction to Next Paint measures how long the browser takes to respond visually after a user interaction, such as clicking a menu, opening a search box, or expanding a comment section.
Blogging websites fail INP not because of complex user interfaces, but because of excessive JavaScript executed on every page.
Modern blog setups frequently include analytics scripts, ad network code, comment systems, social sharing widgets, and page builders. Each adds JavaScript that competes for the main thread.
When a user clicks anything, the browser may wait hundreds of milliseconds for scripts to finish executing before repainting.
WordPress page builders are a major contributor. Even on simple blog posts, builders enqueue large JavaScript bundles intended for sliders, animations, and dynamic layouts that are never used on the page. The browser still parses and executes them.
INP Bottleneck
Typical Blog Source
Practical Resolution
Long JavaScript tasks
Page builders, ad tech
Remove unused scripts, split bundles
Event handler delays
Heavy theme JS
Defer non-essential JS
Third-party blocking
Analytics and embeds
Load asynchronously or conditionally
Main thread congestion
Too many plugins
Audit and remove plugins
Improving INP requires reducing JavaScript, not optimizing it cosmetically. The most effective changes usually come from disabling entire script categories, not minifying them. Blogs that pass INP typically load under 100 KB of JavaScript on article pages.
Cumulative Layout Shift: Why Blog Pages Jump While Reading
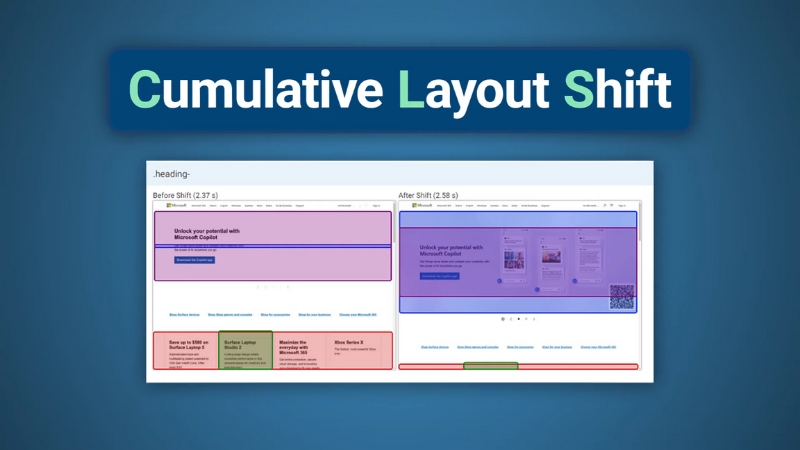
Cumulative Layout Shift measures how much visible content moves unexpectedly during page load. Blogs fail CLS more often than any other site type because they insert dynamic elements after the initial render.
The most common CLS culprit is advertising. Many blogging sites load ads without reserving space, causing text to shift when ads appear.
Even non-ad blogs suffer CLS from embedded YouTube videos, social media posts, or newsletter signup boxes that expand after JavaScript executes.
Another frequent source is images without defined width and height attributes. When the browser does not know the image dimensions in advance, it cannot allocate space, so the layout shifts once the image loads.
CLS Source
Why It’s Common on Blogs
Corrective Action
Ads without reserved space
Programmatic ad loading
Define fixed ad containers
Images without dimensions
Legacy content
Add width and height attributes
Late-loading embeds
Social media integrations
Use placeholders
Font swapping
External web fonts
Preload fonts, limit variations
CLS is not a performance problem in the traditional sense. It is a layout discipline problem. Blogs that control their layout strictly and avoid injecting elements mid-render almost always pass CLS, even on slower connections.
Hosting and Server Response: The Hidden Multiplier
While Core Web Vitals are front-end metrics, server response time amplifies every failure. Blogging websites often run on underpowered shared hosting with high Time to First Byte, sometimes exceeding 800 ms.
This delays all subsequent rendering steps, making even optimized assets appear slow.
Hosting Factor
Impact on Core Web Vitals
High TTFB
Delays LCP and INP
No full-page caching
Repeated server processing
Geographic latency
Slower mobile experiences
Overloaded PHP processes
Inconsistent performance
Improving hosting does not automatically fix Core Web Vitals, but poor hosting makes passing them statistically unlikely, especially at the 75th percentile required by Google.
Why “Optimization Plugins” Rarely Solve the Problem Alone

Many blogging websites install optimization plugins expecting automatic compliance. These tools help with compression, caching, and basic deferrals, but they cannot fix architectural issues like bloated themes, excessive plugins, or ad-driven layout shifts.
Core Web Vitals failures are rarely caused by missing compression or caching headers. They are caused by design and content decisions made early in site development. Retrofitting performance onto a plugin-heavy blog has diminishing returns.
Measuring Correctly: Lab Data vs Real Users
A common mistake among bloggers is relying exclusively on lab scores from Lighthouse. Core Web Vitals rankings depend on field data collected from real users.
A page that scores 95 in Lighthouse can still fail Core Web Vitals if mobile users on slower devices experience delays.
Measurement Tool
Data Type
What It Tells You
Lighthouse
Lab
Potential issues
PageSpeed Insights
Lab + Field
Real-world pass or fail
Chrome UX Report
Field
Ranking-relevant data
Search Console CWV
Field
Site-wide status
Effective fixes should be validated against field data over several weeks, not single test runs.
Structural Patterns of Blogs That Pass Core Web Vitals
@build_in_public You’re wasting your time optimizing your website for Google PageSpeed Insights. Trying to get a good grade doesn’t matter at all for SEO. Number one thing is to make sure it’s fast for friends and family in different places. Actually test it. I’ve seen sites with high PageSpeed Insights scores where nothing actually loads. But mostly I’ve seen sites with bad scores that load fast, have great rankings, and get tons of organic traffic from Google search. #seotips #searchengineoptimization #digitalmarketing #seohacks ♬ som original – 𝙫𝙞𝙘𝙠𝙞𝙚★
Blogs that consistently pass Core Web Vitals share several structural traits. They use lightweight themes, avoid page builders on article templates, load minimal JavaScript, and treat ads and embeds as controlled layout elements rather than dynamic inserts.
Content is prioritized over decoration, and performance is considered part of editorial quality.
Passing Core Web Vitals is not about chasing green scores. It is about respecting how browsers render pages and how real users experience content on constrained devices and networks.
Blogging websites fail when performance is treated as an afterthought instead of a foundational requirement.