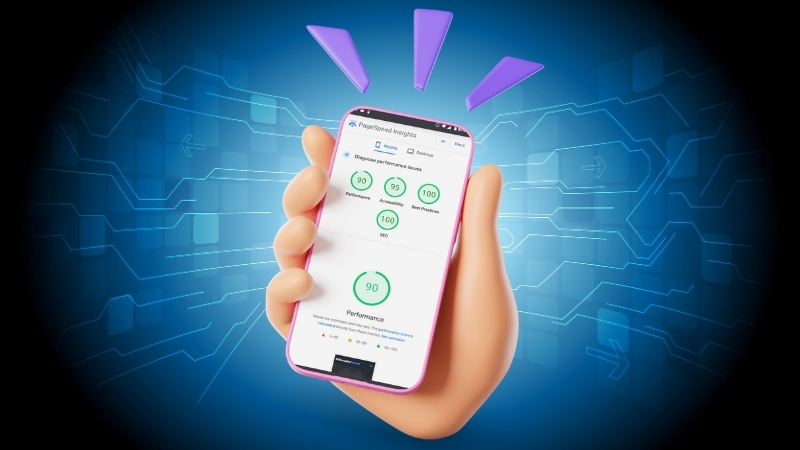
Reaching a consistent 90+ score on Google PageSpeed Insights for mobile is not about installing one plugin or switching to a faster theme.
It requires reducing real-world loading bottlenecks that affect Core Web Vitals, especially Largest Contentful Paint (LCP), Interaction to Next Paint (INP), and Cumulative Layout Shift (CLS).
In practice, blogs that reliably score above 90 on mobile share three traits: lean server response times, disciplined asset loading, and strict control over JavaScript execution.
This article explains the full, step-by-step process that actually works in 2024–2025, based on how Google measures performance today and how modern browsers execute pages on mid-range mobile devices.
Step 1: Establish a Realistic Performance Baseline
Before touching optimization, you must understand what Google is actually measuring. PageSpeed Insights combines lab data from Lighthouse with field data from the Chrome User Experience Report when available.
The mobile score is calculated using a simulated Moto G Power–class device on a throttled 4G network. This matters because many blogs “feel fast” on desktop but collapse on mobile due to CPU-bound JavaScript and blocking resources.
At this stage, you should record baseline values for LCP, INP, CLS, Total Blocking Time, server response time (TTFB), and the number of requests. Without these numbers, optimization becomes guesswork and often leads to cosmetic changes that do not move the score.
Metric
Target for 90+ Mobile
Common Blog Baseline
LCP
≤ 2.5s
3.5–5.5s
INP
≤ 200ms
300–700ms
CLS
≤ 0.1
0.15–0.35
TBT
≤ 200ms
400–1200ms
TTFB
≤ 800ms
1.2–2.5s
Requests
< 70
120–220
Blogs that fail to hit 90+ almost always miss at least two of these targets.
Step 2: Fix Server Response Time Before Frontend Tweaks
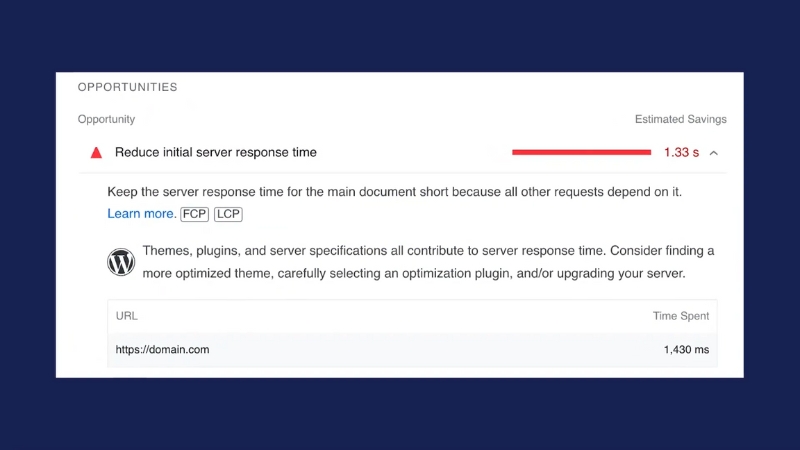
TTFB is the foundation. If your server takes too long to respond, no amount of frontend optimization will compensate on mobile. Google’s documentation and Lighthouse weighting show that TTFB directly impacts LCP and indirectly affects JavaScript execution timing.
For WordPress and similar CMS-driven blogs, the most common TTFB killers are shared hosting, uncached PHP execution, and slow database queries. Moving from generic shared hosting to a properly configured VPS or managed WordPress environment typically reduces TTFB by 40–70 percent.
Enabling full-page caching at the server level, not just via plugins, is critical.
Hosting Setup
Typical Mobile TTFB
Shared hosting (no server cache)
1.8–2.5s
Shared hosting with plugin cache
1.2–1.6s
VPS with server cache
400–700ms
Managed WP with edge cache
200–500ms
If TTFB remains above 1 second on mobile, PageSpeed scores above 90 are mathematically unlikely.
Step 3: Control Largest Contentful Paint at the Element Level
View this post on Instagram
LCP is not abstract. It is a specific element, usually the featured image, hero image, or first content block. Blogs often fail here because themes load large hero images without prioritization or lazy-load the very element that defines LCP.
To fix LCP, the primary content image must be compressed, sized correctly, served in a modern format like WebP or AVIF, and loaded immediately with high priority. Preloading the LCP image and ensuring it is not blocked by CSS or JavaScript can reduce LCP by over one second on mobile.
LCP Mistake
Real Impact
Lazy-loading hero image
+800–1500ms
Oversized image (desktop size on mobile)
+600–1200ms
No preload hint
+300–700ms
Render-blocking CSS before the image
+500–900ms
Many blogs lose 20–30 PageSpeed points solely due to misconfigured LCP behavior.
Step 4: Eliminate Render-Blocking CSS Without Breaking Layout
Google flags render-blocking CSS because it delays the first paint and LCP. Blogs often rely on large CSS bundles loaded synchronously in the head, even when only a fraction is needed above the fold.
The correct approach is not to remove CSS but to split it. Critical CSS for above-the-fold content should be inlined, while non-critical styles should load asynchronously. This reduces initial render time while preserving layout integrity.
CSS Strategy
Mobile Impact
Single blocking CSS file
Poor LCP, poor FCP
Inline critical + async rest
Strong LCP gains
Excessive inline CSS
CLS risk
Unused CSS was not removed
TBT increase
Poor CSS handling is a silent killer of mobile scores because it compounds with slow servers and heavy JavaScript.
Step 5: Reduce JavaScript Execution, Not Just File Size
Modern blogs rarely fail because JavaScript files are “too big.” They fail because JavaScript runs too much during initial load. Google’s move from FID to INP in 2024 makes this even more important, as all interactions now count, not just the first one.
Common issues include analytics scripts, ad tech, social embeds, page builders, and third-party widgets executing immediately. Deferring and delaying JavaScript execution until user interaction often cuts Total Blocking Time in half.
JavaScript Source
Typical Mobile Cost
Page builder runtime
150–400ms TBT
Analytics + tag managers
100–300ms
Ad scripts
200–600ms
Social embeds
100–250ms
Blogs that score above 90 almost always delay non-essential scripts until after initial interaction or idle time.
Step 6: Optimize Images Beyond Compression
@thewizardmarketing image compression gets you SEO and web performance all in one shot. #website #webdev #webdesign #seo #searchengineoptimization #pagespeed #google ♬ original sound – Jake | The Marketing Wizard
Image compression alone is no longer enough. Mobile performance depends on responsive sizing, correct srcset usage, and preventing layout shifts. CLS penalties often come from images without width and height attributes or dynamically injected media.
Using responsive images ensures that mobile devices download significantly smaller assets. Explicit dimensions prevent layout jumps that hurt CLS scores.
Image Optimization Technique
Effect
WebP or AVIF
25–50% size reduction
Responsive srcset
40–70% mobile savings
Explicit dimensions
CLS stabilization
Lazy-loading non-LCP images
Faster initial render
Poor image handling can sabotage otherwise excellent server and JavaScript optimizations.
Step 7: Reduce Request Count and Third-Party Dependency
Every HTTP request adds overhead to mobile networks. Blogs that load dozens of fonts, icons, embeds, and external scripts accumulate latency that Lighthouse penalizes heavily.
Reducing request count is often about discipline. Self-host fonts, remove unused icon libraries, and question whether each third-party script delivers measurable value.
Request Type
Mobile Cost
External fonts
100–300ms
Icon libraries
50–150ms
Embedded iframes
200–500ms
Tracking pixels
50–100ms each
Mobile PageSpeed scores above 90 rarely coexist with more than 80 network requests.
Step 8: Stabilize Layout to Protect CLS
CLS is often overlooked because it does not affect “speed” in the traditional sense, but Google weighs it heavily. Ads loading late, font swaps, and dynamic content injection are the main culprits.
Explicit space reservation for ads and media, along with proper font loading strategies, stabilizes layout and prevents score drops that can be hard to diagnose after the fact.
CLS Source
Typical CLS Impact
Late-loading ads
0.1–0.25
Font swap without fallback
0.05–0.15
Dynamic embeds
0.05–0.2
A CLS above 0.1 alone can prevent a 90+ score even if all other metrics pass.
Step 9: Validate Using Field Data, Not Just Lighthouse
Lab scores can be misleading. Real success is reflected in Chrome User Experience Report data over 28 days. Blogs that hit 90+ in Lighthouse but fail in real usage usually have inconsistent hosting, heavy ads, or user-triggered scripts that were not simulated in tests.
Monitoring real-world Core Web Vitals ensures optimizations actually hold under traffic.
Data Source
Purpose
PageSpeed Insights
Lab + field overview
Search Console CWV
Google ranking signals
Web Vitals JS
Real user measurement
Bottom Line
Achieving a 90+ mobile PageSpeed score for a blog is not about chasing Lighthouse warnings one by one. It is a systems problem involving server performance, asset prioritization, JavaScript restraint, and layout discipline.
Blogs that consistently reach this threshold treat performance as part of content delivery, not as an afterthought.
When server response times drop below 500ms, LCP elements are prioritized correctly, JavaScript execution is delayed, and layouts are stable, a 90+ score becomes predictable rather than accidental.